Application performance testing
Jama Software runs daily performance testing of Jama Connect. The frequency depends on your environment.
Cloud performance test results
Cloud — Continuous performance monitoring
Jama Software continuously monitors application performance in the cloud. We utilize Real User Monitoring (RUM) technology to understand performance at the end-user level.
This performance monitoring includes network latency and transmission of the entire user request across our global customer base.

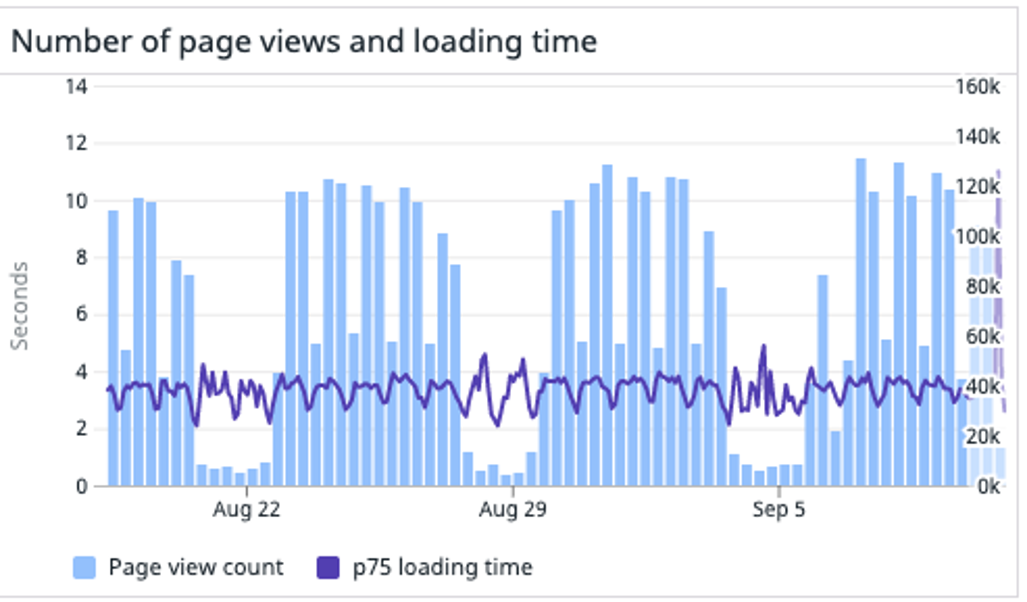
The Jama Connect cloud environment serves an average of over 6 million pages per month with hundreds of millions of total requests.
The P75 total page load time (from request to full browser paint) averages 3.41 seconds.
The P75 total page load time (from request to full browser paint) averages 3.41 seconds. The cumulative average of all page loads is under 3 seconds (2.66).

We gauge cloud performance on a consumer web scale, which is superior to most enterprise B2B applications.
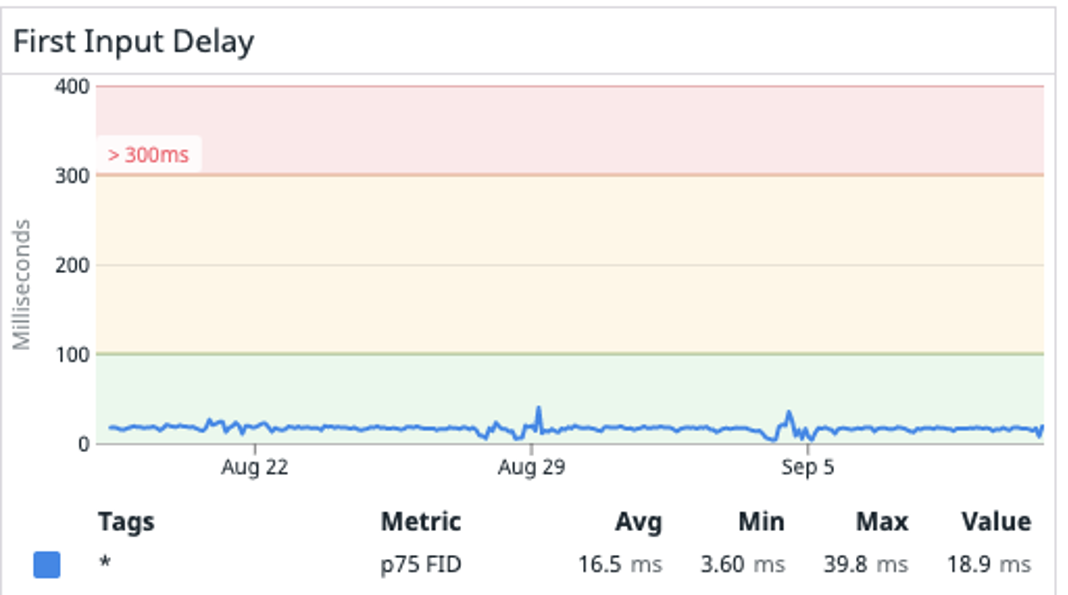
First Input Delay (FID) averages 16.5ms across the cloud environment and is a critical component of a responsive web experience.