Understanding the diagram
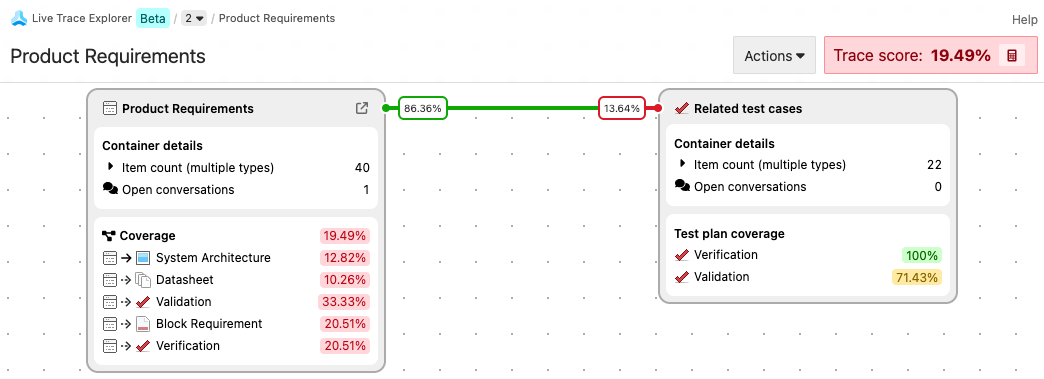
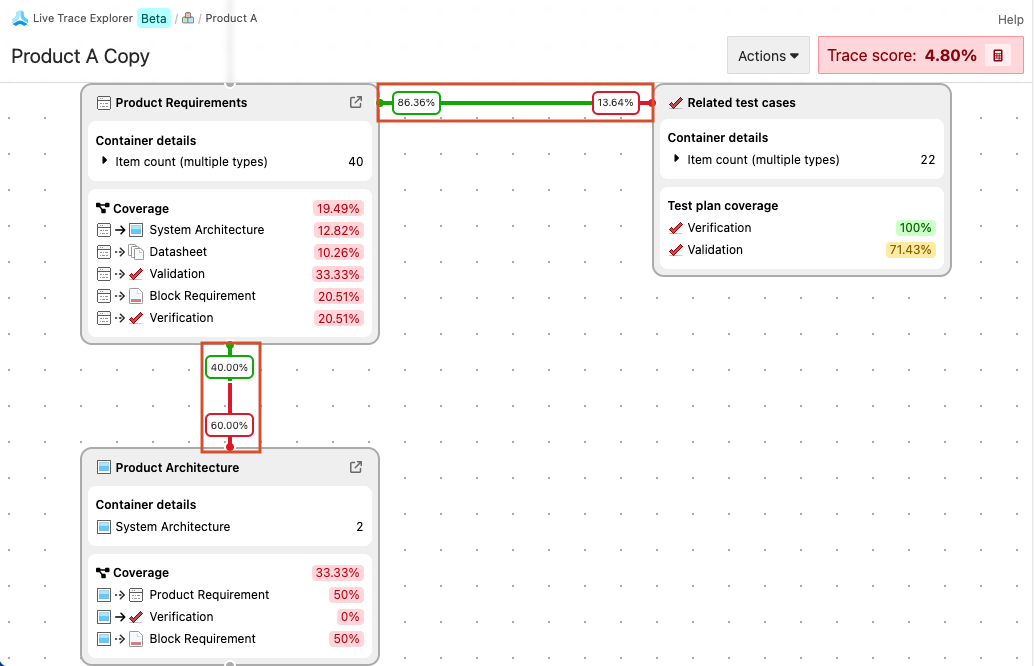
The Trace Score in the upper right corner of the generated diagram indicates the completeness of your project’s traceability. A score of 100% means that all requirements are met for the expected relationships in your diagram, according to the relationship rules of your project.

Specification tiles and coverage
Specification tiles are generated from the project tree and appear vertically in the diagram in the same order as the project tree. Test item types don’t appear as specification tiles.
Test case tiles and coverage
A test case tile is generated from and paired horizontally with a specification tile when a relationship exists between the item types and a test case item type.
Trace paths
Paired tiles in the diagram are connected by a trace path. The trace path indicates the percentage of valid (green) and suspect (red) relationships between the items in the paired tiles.
The vertical trace path shows the relationship of items between a pair of connected (upstream and downstream) specification tiles. The horizontal trace path shows the relationship of items between a specification tile and its related test cases.
Suspect links
A relationship between two items is considered suspect when changes are made to an upstream item, so that the relationship might no longer be correct or complete.
For example, if a requirement changes, the change causes a suspect relationship to the verification item.

The horizontal and vertical trace paths don’t affect or contribute to the Trace Score. The number represents the percentage of valid relationships between the items in the upstream tile and the items in the downstream tile.
With this information, you can pinpoint areas that need attention and investigate by looking at each relationship and item.

By default, the trace path displays a percentage. When you hover over the percentage, the exact number of valid relationships is displayed.