How the trace path figures are calculated
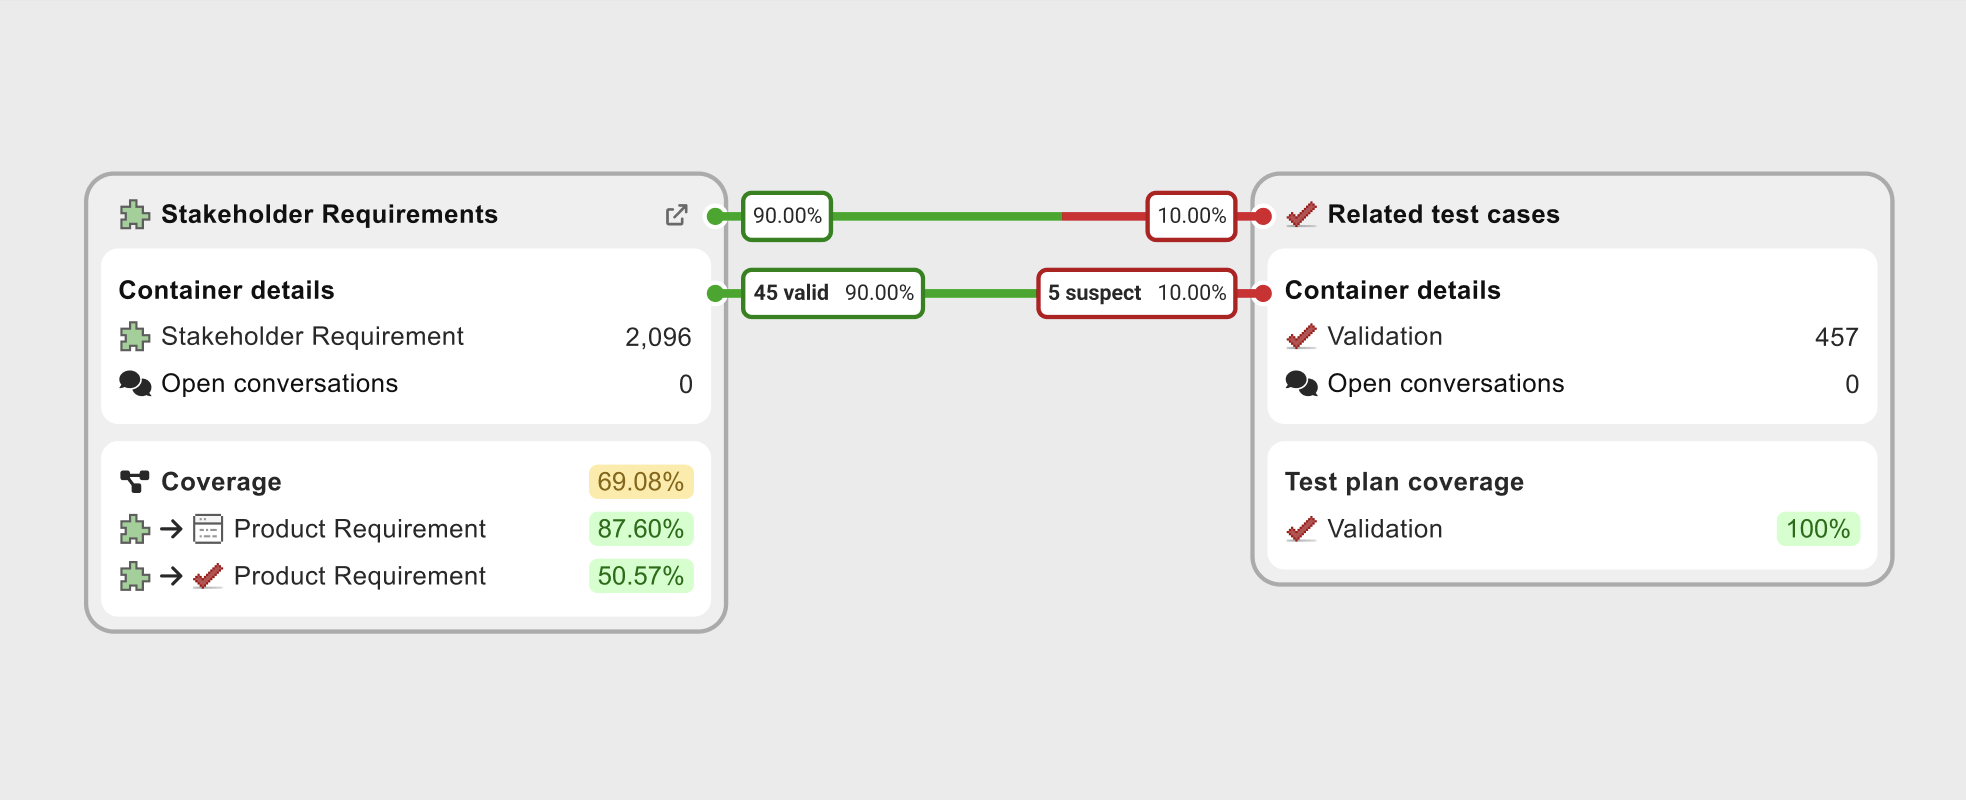
In the generated diagram, the horizontal and vertical trace paths between the tiles represent the validity of the relationships between items in the paired tiles.
The default view of the trace path displays the percentage of valid and suspect links. You can see the actual number of valid and suspect links by hovering over the trace path percentage.
Horizontal trace path — The validity of the relationships between a parent tile and its corresponding test case tile.
Vertical trace path — The validity of the relationships between a parent tile and its downstream child tile.
The percentage and number are calculated in this manner:
Calculates the total number of existing relationships between the parent tile and its corresponding child tile.
Compares the total against the number of valid relationships (green), presented as a percentage of the total.
Compares the total against the number of suspect relationships (red), presented as a percentage of the total.
Example
A tile pair has a total of 50 existing relationships, with 45 valid and 5 suspect relationships.
% of valid relationships = 90% (45/50 x 100 = 90%)
% of suspect relationships = 10% (5/50 x 100 = 10%)
For this example, the horizontal trace path displays these calculations:
