Configure the dashboard (for admins only)
The dashboard feature allows organization and project admins to customize a project dashboard so that it displays the information needed by project members. Dashboard changes are made at the project level.
Important considerations
Only organization and project admins can create or modify dashboards.
You must create a filter before you can generate a graph or filter list dashboard widget.
Each dashboard must have a unique name. Also, descriptive names can help you organize and manage your dashboards.
The initial project dashboard is allowed an unlimited number of widgets, and subsequent dashboards are limited to 20 widgets.
Notice
For optimal performance, limit the number of widgets to a maximum of 20, even in the initial project dashboard.
Projects must have at least one dashboard. You can have a maximum of 20 dashboards per project.
The first dashboard created for a project is automatically set as the default dashboard for all users.
If you delete the project default dashboard, you are prompted to select a new dashboard as the default.
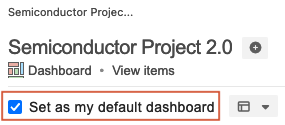
Users can customize which dashboard first appears upon their login by viewing the dashboard of their choice and selecting set as my default dashboard
Dashboard names appear in alphabetical order.
To set up the dashboard:
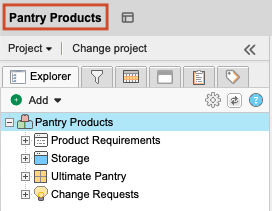
From the Explorer Tree, select a project name to open the project dashboard.
To add a widget to the dashboard:
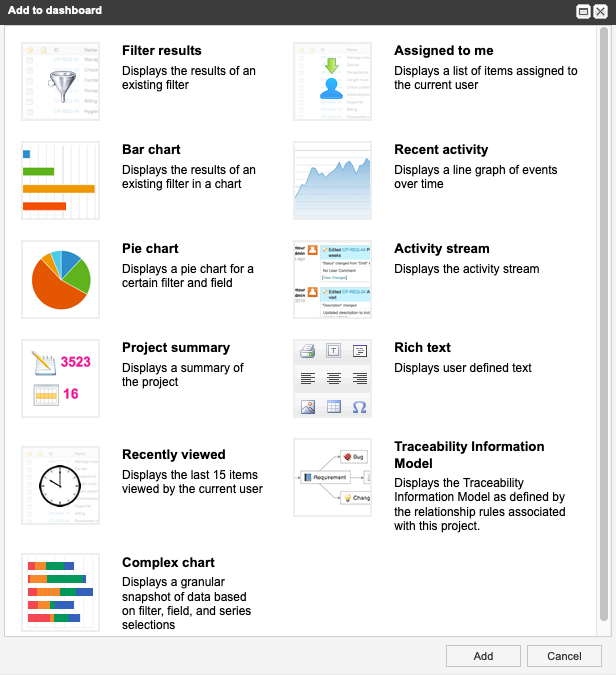
Select Add widget in the top right toolbar of the dashboard.

In the window that opens, select the dashboard widget options you want, then select Add.
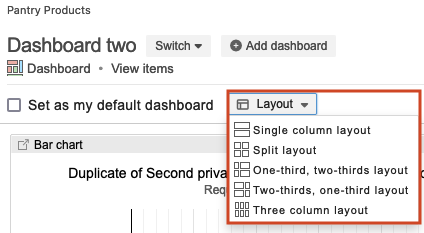
Select Layout in the toolbar, then choose how you want the windows to appear on the dashboard.
To create an additional dashboard, select Add dashboard in the toolbar.
In the window that opens, enter a unique name.
Select Create.
The screen is refreshed and the new dashboard appears.
To edit the name of a dashboard, select Edit.
Enter a new name.
Select Save.
A pop-up message confirms that the new name was saved.
To view a different dashboard, select from the Switch drop-down menu.
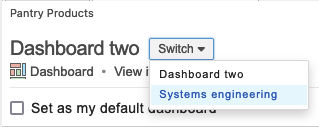
To see the current dashboard when the project page loads, select Set as my default dashboard.
To download or view data from a chart, select an option from the drop-down menu. (Options only appear in the Bar, Line, Pie, and Complex chart widgets.)
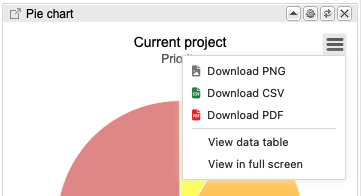
Download PNG — Downloads the widget image.
Download CSV — Downloads the data from the chart.
Download PDF — Downloads the widget image.
View data table — Displays the data table/chart and the numerical information associated with the data.
To print the contents of your dashboard, select Print.
Tip
For best results, use landscape page setup and enable printing of background images in your browser settings.
If you made changes to a project dashboard, they appear the next time you open it.