Dashboard widget options
You can customize a project dashboard to display the information needed by project members. Dashboard changes are made at the project level.
Note
To manage the dashboard, you must have organization admin or project admin permissions.
The following widgets can be added to the dashboard.
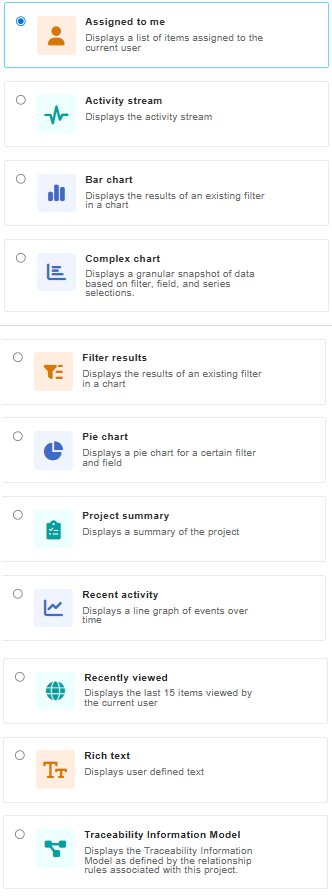
Filter results |  | Displays the results of an existing filter in a chart: Name the window, select a filter and which columns to display, and select how many items to display. |
Bar chart |  | Displays the results of an existing filter as a bar chart. Configure the name, filter, field shown, and number of elements with the gear icon in the top right. Select individual bars in the bar chart to view those items in a new tab. |
Pie chart |  | Displays a pie chart for a filter and field that the user selects. Configure the filter and field with the gear icon button in the top right. Select the individual items in the pie chart to open those items in a new tab. |
Project summary |  | Displays a summary of the entire project, including total number of items in the project, number of days until next release, and number of days until project completion. |
Recently viewed |  | Displays the last 15 items viewed by the current user. Select a recently viewed item to open it in a new tab. |
Assigned to me |  | Displays a list of items assigned to the current user. |
Recent activity |  | Displays a line graph of recent activity over a period of time. |
Activity stream |  | Displays the current activity stream of the project. View all current activity including comments, edits made, new items created, and assignment changes. Use the filters at the top right to filter only comments, activities, or search for specific items. |
Rich text |  | Displays user-defined text, images, diagrams, and equations. Select the gear icon to insert text, pictures, and tables with the same rich text options as an item description field. |
Traceability Information Model |  | Displays the relationship rules applied to the project. |
Complex chart |  | Displays a granular snapshot of data based on filter, field, and series selections. Select the gear icon to configure the filter, fields, and series. Select individual bar sections in the stacked bar chart to view those items in a new tab. |
The following custom field types are available for grouping when defining chart widgets (Bar, Pie, Complex Charts):
Pick list fields (single select)
User fields
Flag fields
System fields available for grouping in charts include:
System User fields (Created by, Modified by, Last Locked by)
Locked (Flag field)
Item Type
Project