Exporting documents from Jama Connect
While Jama Connect alleviates many pain points around managing documents, you might still need to create documents to share with your customers, quality teams, or auditors.
The basics
With Jama Connect, you can easily create documents using our standard export to Word and Excel or by creating your own custom office templates.
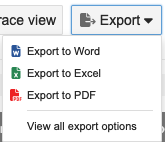
You can export the items that appear in your Jama Connect view with these export options:
Beyond the basics with Office templates
If you need more than what the default Office templates provide, you can customize a template to suit your project. For details about how to create a custom Office template:
Exports (User Guide)
Word Template Guide (Community)
Advanced reporting
If you require more control over the report output than Word templates provide, you can use an advanced reporting tool like BIRT or Velocity.
Here are some common scenarios for using an advanced reporting tool:
Ordering of documents — Word templates always arrange your included items in the same order that they appeared in Jama Connect when you generated the export. If you need like items to stay together or certain item types to always be displayed before other types, you need to use a custom export.
Style formatting — Although Word templates support basic text formatting like bullets and fonts, text size and color, they don’t support page formatting options like section breaks or custom page numbering. BIRT and Velocity exports provide a broader level of control than Word.
Multiple levels of relationships — Default Word templates can export relationships one level upstream or one level downstream. BIRT and Velocity can follow relationships and tree structure through multiple levels.
Conditional logic — BIRT and Velocity both allow more control over when and where to display information. For example, an advanced reporting engine lets you display an item’s status, but only if it were created more than 30 days ago and has an upstream relationship to a feature.
For more detailed information about advanced reporting:
Introduction to Advanced Reporting (Community)
There are inherent differences between the UI and export size. To align points and pixels (WIRIS font to be same size as font size), you must manually configure the size to account for approximately 33% of the difference.
Dashboards
You can configure your projects to show key metrics so you can quickly see what needs attention. Typically, dashboards are used to:
Monitor progress — For example, status of Requirements or Execution Results of a Test Cycle.
Audit progress — For example, show the count of items that are missing a critical data point or process step.
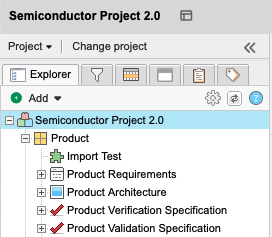
To access the dashboard, select the project name in the Explorer Tree.
As an administrator with organization or project permissions, you can customize dashboards per project (not per user).
Customizations include:
Filter results | Displays the results of an existing filter. |
Assigned to me | Displays a list of items "assigned to" the current user. |
Bar chart | Displays the results of an existing filter as a bar chart. |
Recent activity | Displays a line graph of recent activity over a period of time. |
Pie chart | Displays a pie chart for a filter and field that the user selects. |
Activity stream | Displays the current activity stream of the project. View all current activity including comments, edits made, new items created, and assignment changes. |
Project summary | Displays a summary of the entire project, including total number of items in the project, number of days until next release, and number of days until project completion. |
Rich text | Displays user-defined text, images, diagrams, and equations. |
Recently viewed | Displays the last 15 items viewed by the current user. |
Relationship diagram | Displays the relationship rules applied to the project. |
Exporting equations and alignment guidelines
Organization admins can save MathType and ChemType equations in PNG and SVG formats. For the best web, exporting, and print experience, use PNG format with quality 300 dpi.
When the equation format is changed, existing equations keep their current format until edited. Depending on the format, the exported image might produce different results. Here's what to expect when equations are exported and surrounded by text in PNG and SVG formats:
PNG format — Recommended for the best web and printing experience. The bottom of the primary equation line always aligns with the bottom of the surrounding text. The outermost fraction bar always aligns with the middle of the surrounding text line.
SVG format — Produces the most varied export results because SVG doesn't handle embedded fonts well, which can rearrange certain characters when exported to Word. There is no height information, so equations might have different alignment with surrounding text depending on the overall dimensions.